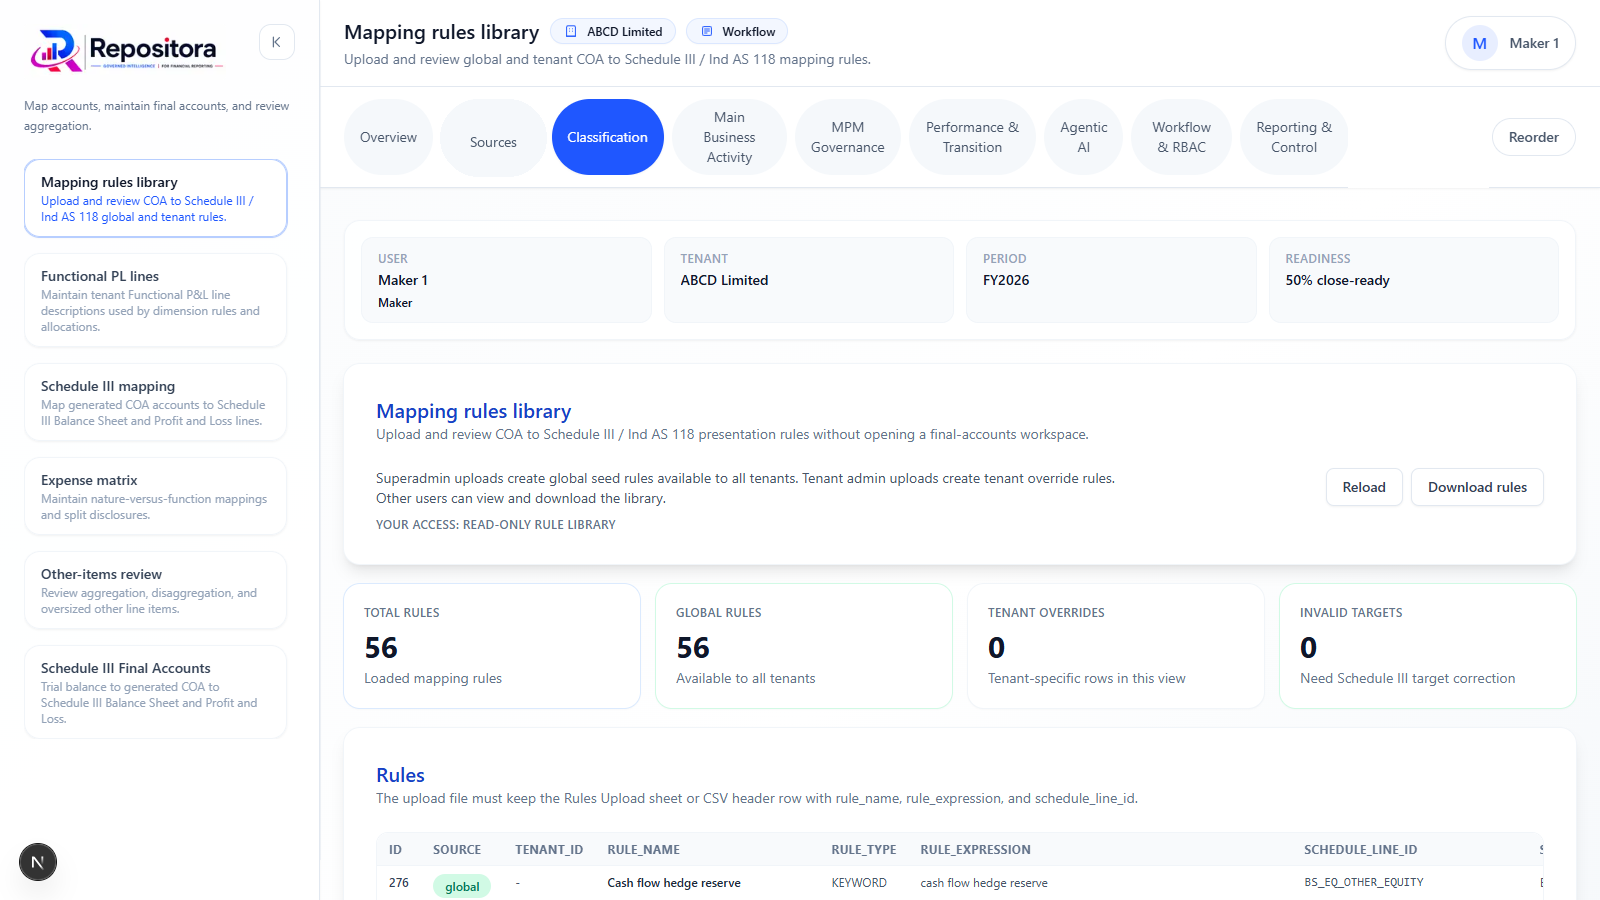
Mapping COA To Schedule III And Ind AS 118 Presentation Lines is a practical topic for any finance team preparing for IFRS 18 and the proposed Ind AS 118. The subject is not only a matter of changing a report format. It affects how source data is selected, how judgements are documented, and how users can understand the final statement of profit or loss.
The immediate focus is controlled mapping from chart of accounts to Schedule III and Ind AS 118 presentation lines. This may sound like a specialist reporting topic, but it becomes important as soon as a company tries to produce a controlled current-year and comparative view. A decision that is left informal in a spreadsheet can later affect classifications, subtotals, management-defined performance measures, and note disclosures.
IFRS 18 is effective for annual reporting periods beginning on or after 01-01-2027. In India, ICAI has issued the exposure draft of Ind AS 118 and NFRA has recommended the Standard to the Central Government. Companies should monitor the final MCA notification, Schedule III updates, and any related regulator guidance, but the preparation work can begin earlier because much of it is operational.
A useful way to approach the transition is to ask whether the organisation can regenerate and explain the report from approved source data. If the answer depends on one person's workbook, manual judgement notes, or undocumented reclassifications, the process may need strengthening before the standard becomes mandatory.
The relevant standard angle is that financial statement line items and subtotals should be generated from clear grouping and classification logic. IFRS 18 is designed to improve communication in financial statements through a clearer structure, defined subtotals, better aggregation and disaggregation, and disclosures around management-defined performance measures. The proposed Indian equivalent follows the same direction, subject to final notification.
The Standard does not turn every reporting judgement into a mechanical rule. It expects management to apply judgement, but it also expects that judgement to produce information that is useful to users. That means the reporting process needs enough structure to be consistent and enough flexibility to reflect the entity's facts.
For finance teams, the key shift is from presentation as a year-end formatting exercise to presentation as an end-to-end reporting process. Data capture, mapping, classification, review, disclosure drafting, and approval all contribute to the quality of the final report.
This is also why system design matters. If the system stores the conclusion but not the evidence, the process is weak. If it stores the evidence but does not apply the conclusion to the reports, the process is incomplete. The better design connects evidence, judgement, calculation, and disclosure.
The practical problem is that manual mapping workbooks often mix standard rules, company-specific judgements, overrides, and unresolved exceptions without a clear audit trail. This problem usually appears during close, when deadlines are tight and reviewers need answers quickly. A reporting team may know the answer informally, but the system may not show it.
The risk is not limited to incorrect totals. Totals can be correct while the presentation is weak. An amount can be included in the right profit total but still be mapped to the wrong line, classified in the wrong category, allocated to the wrong function, or reconciled to an MPM without enough support.
Comparatives increase the challenge. A current-year decision must often be compared with how the same account or activity was treated in the previous year. If the prior-year basis is not visible, the team may spend time rebuilding history instead of analysing the financial effect.
The problem is more visible in groups with multiple entities, ERPs, locations, cost centres, or reporting packs. The more complex the source landscape, the more important it is to avoid hidden assumptions.
A controlled process should capture and preserve account names, mapping rule source, confidence, schedule line, category, exception status, reviewer comments, and approval details. These fields are not decoration. They are the evidence that lets a reviewer understand how a financial statement line was created.
Good data design starts with the active source. If the source is an uploaded trial balance, the trial balance should contain the dimensions needed for reporting. If the source is a GL-derived trial balance, the derivation should preserve transaction-level dimensions and show how they were aggregated.
Current and previous years should be treated as first-class reporting periods. A current-year-only structure creates avoidable work when comparatives are required. Even if the comparative source is less detailed, the limitation should be visible and handled through a documented transition approach.
The data model should also preserve approval status. An unapproved upload, mapping, allocation, or MPM definition should not silently feed a locked report. Draft information can be useful for preview, but final outputs should clearly distinguish draft from approved data.
The core workflow is combining global rules, company rules, manual review, and exception handling in one governed mapping process. This workflow should be visible to the user, not only embedded inside backend logic. Users should know which step they are in, which records are approved, and which exceptions remain open.
A strong process normally includes maker-checker controls. The maker prepares or uploads the record, and the checker reviews and approves it. In a demo or controlled internal setup, auto-approval may be used for a system user, but the audit trail should still record both events.
The best workflows keep audit evidence close to the data. If a user is reviewing a source card, mapping rule, expense allocation, or MPM definition, the relevant approval timestamp and user should be visible there. A separate audit log is useful, but it should not be the only place where status can be understood.
Controls should also be proportionate. The system should not force every small decision through excessive steps, but material inputs and judgements should be traceable. The point is not bureaucracy. The point is explainability.
Repositora keeps mapping rules, unmapped accounts, and user overrides visible so reviewers can focus on real risk. This is a subtle but important design principle: the application should not merely produce a final report; it should help the finance team understand the path from source to report.
The most useful workflow begins with ingestion and validation. The user uploads or imports source data, validates totals and dimensions, and selects the active basis for reporting. From there, mapping and classification rules operate on the approved source rather than on a manually copied extract.
The next layer is review. Exceptions, missing mappings, low-confidence rules, unusual items, and MPM candidates should be surfaced before the report is locked. Users should be able to correct or approve the relevant records without leaving the reporting context.
The final layer is output. Reports, schedules, disclosures, and exports should be generated from the same controlled base. If a reviewer asks why a number appears where it does, the user should be able to trace it back to source data, mapping, classification, and approval history.
The first pitfall is assuming that a balanced trial balance is automatically ready for IFRS 18 or Ind AS 118 style reporting. A trial balance can balance perfectly while lacking the dimensions needed to classify, allocate, or disclose information properly.
The second pitfall is allowing spreadsheets to become the system of record for judgement. Spreadsheets are useful analysis tools, but when the final conclusion lives only in a spreadsheet, review and repeatability become difficult.
The third pitfall is treating comparatives as an afterthought. Presentation changes usually require a comparative view. If prior-year data is not prepared with the same structure, the team may face avoidable pressure during reporting.
The fourth pitfall is mixing standard templates and company-specific records. Templates are useful starting points, but approved company definitions, especially for MPMs and allocation policies, should be separately saved and versioned.
The fifth pitfall is hiding exceptions. Exceptions should not be embarrassing; they are useful signals. A missing mapping, incomplete dimension, or unresolved allocation tells the team where review is needed before the report is final.
The sixth pitfall is over-automation. Rules, AI suggestions, and templates can improve speed, but accounting judgement still needs ownership. The system should show what was suggested, what was changed, and who approved the final position.
- Can the team identify the active source used for the current reporting period, and can it show whether that source came from an uploaded TB or a GL-derived TB?
- Can each material reporting line be traced back to source balances, mapping rules, classification rules, and approval history?
- Are current-year and previous-year amounts prepared using comparable dimensions and presentation logic?
- Are manual adjustments, overrides, and MPM reconciliation lines supported by a clear source reference and narration?
- Are exceptions visible before final report lock, or are they only discovered during manual review of the final statement?
- Is there a clear owner for each major judgement, and is checker approval recorded in a way that future reviewers can understand?
For a demonstration, the strongest story is usually not to show every feature. It is better to show a controlled journey. Begin with the source data, explain why the selected source is appropriate, show how the system validates it, and then move to mapping and classification.
Next, show one or two meaningful exceptions. For example, an account that needs a classification decision, an expense that needs functional allocation, or a performance measure that needs MPM assessment. This helps the audience see that the system supports judgement rather than hiding it.
Finally, show the output and the audit trail. The report should feel like the consequence of the controlled workflow, not a disconnected document. This is where a subtle product message becomes stronger than a marketing claim: the user can see the trace from data to disclosure.
A practical implementation can begin with one entity and two periods. The aim should be to prove the source model, mapping logic, category classification, expense allocation, MPM governance, and report generation before scaling to more entities.
The first milestone is source readiness. This includes upload formats, validation checks, dimension completeness, control totals, and source selection. If this stage is weak, later automation will only make weak data move faster.
The second milestone is rule readiness. Mapping rules, classification rules, and allocation rules should be tested against real data. Exceptions should be resolved or formally accepted. Rules should be versioned so changes are not lost.
The third milestone is disclosure readiness. MPM definitions, specified expense support, aggregation reviews, and report schedules should be prepared early enough to allow review. Disclosure should not be left until the end of the close.
The final milestone is close readiness. The team should run a dry close, generate outputs, review audit trails, and confirm that the report can be recreated from approved records. This is the point where the process becomes reliable.
Mapping COA To Schedule III And Ind AS 118 Presentation Lines is ultimately about making performance reporting more explainable. The standard may be written in terms of presentation and disclosure, but the work reaches into data, controls, workflow, and governance.
Companies that start early can use the transition to improve the reliability of their reporting process. They can reduce manual rework, clarify ownership of judgements, and make the final report easier to review.
The best outcome is not simply a new format. It is a reporting process where finance teams can show how a number moved from source file to statement line to disclosure note, with the relevant judgement and approval evidence preserved along the way.
This article is educational and reflects public source material available as of 21-06-2026. Indian applicability should be checked against final MCA notification, Schedule III amendments, SEBI updates, and other regulatory communications.
- IFRS Foundation, IFRS 18 Presentation and Disclosure in Financial Statements: https://www.ifrs.org/issued-standards/list-of-standards/ifrs-18-presentation-and-disclosure-in-financial-statements/
- ICAI, Exposure Draft of Ind AS 118, Presentation and Disclosure in Financial Statements: https://www.icai.org/post/asb-ed-indas118-pdfs
- NFRA, record note recommending Ind AS 118 to the Central Government: https://cdnbbsr.s3waas.gov.in/s3e2ad76f2326fbc6b56a45a56c59fafdb/uploads/2026/01/2026011620325560.pdf